Financial Charting
Advertisement
Candlechart .NET v.1.0
Candlechart .NET is a fully managed financial charting control that can add a whole new level of versatility and interactivity in many technical analysis applications. Developed for thick-client .
Advertisement
AnyChart Stock Chart Component v.1.0
AnyChart Stock and Financial Charts (short name:AnyStock) is an XML/JSON Flash based financial charting solution.

AnyChart Stock and Financial Flash Chart v.1.1.0
AnyStock is a flexible Flash-based solution to create interactive and attractive stock and financial charts with large datasets support and great scrolling options. XML/JSON interface, technical indicators and drawings, full localization support.

Nevron Chart for .NET v.2016.1
Nevron Chart for .NET is a professional charting component for .NET, featuring numerous business, scientific and financial charting types, gauges, VS design time support, AJAX support, built-in toolbar, flexible axes, and much more.

TeeChart for .NET v.2018
TeeChart for .NET Charting Controls offer full set of Chart types and a combination Gauge types for dashboard applications. Support Windows Forms, ASP.NET Core MVC, HTML5, WPF, UWP and Xamarin iOS, Android & Forms.

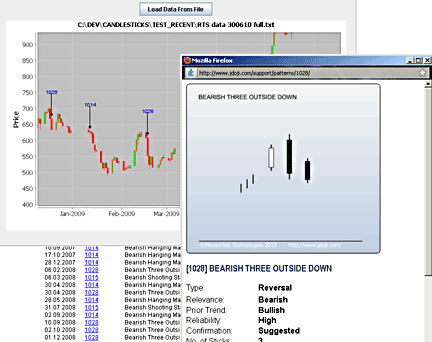
JDoji Candlestick Pattern Recognition Engine DEMO v.1.0
jDoji Pattern Recognition Engine is a high performance pattern recognition engine with pre-built candlestick pattern library included.

AnyStock Stock and Financial JS Charts v.8.7.0
AnyStock Stock and Financial JS Charts is a flexible JavaScript charting library to visualizing large data sets in interactive HTML5 charts. Designed to display date/time information it offers various chart types, drawing tools, technical indicators.

ITLocus Charting v.1. 4. 2015
IT Locus Charting is an advanced charting application for graphical analysis of financial and stock market. It supports any number of windows with an arbitrary number of charts of stocks, futures, mutual funds or indices in each of them. The list of

Financial Icon Library v.4.4
Vista Financial Icon Library is a collection of money and shopping related icons in Windows Vista style. The collection is distributed as BMP, PNG, GIF and ICO files with each icon present in the 16x16, 24x24, 32x32, 48x48, 128x128 and 256x256 sizes.

ICS Free Financial Toolbar
The ICS Free Financial Toolbar puts financial search, stock quotes, charts, SEC filings, stock news, and financial audio commentary at your fingertips! It installs in Microsoft Internet Explorer in seconds and includes a free popup blocker, Google and

Financial Advisor for Excel (Full)
Borrowing, business profitability, discounted cash flows, financial planning, investing, bonds, cost of capital, options, valuation and more in this financial toolbox!!! Financial Advisor for Excel is the Swiss Army Tool of financial calculators: